Infrared Sensor Data Example
[1]:
%matplotlib inline
import numpy as np
import xarray as xr
import warnings
from osirisl1services.readlevel1 import open_level1_ir
from osirisl1services.services import Level1Services
import matplotlib.pyplot as plt
from matplotlib.colors import LogNorm
from scipy.interpolate import interp1d

FIG_SIZE = (15, 6)
Load the IR data for orbit 6432, scan 12
[2]:
channel = 1
ir = open_level1_ir(orbit=6432, channel=channel)
The data and added variables are returned as xarray Datasets
[3]:
print(ir)
<xarray.Dataset> Size: 9MB
Dimensions:          (mjd: 2893, pixel: 128)
Coordinates:
  * mjd              (mjd) float64 23kB 5.239e+04 5.239e+04 ... 5.239e+04
  * pixel            (pixel) int64 1kB 0 1 2 3 4 5 6 ... 122 123 124 125 126 127
Data variables: (12/17)
    stw              (mjd) int64 23kB 598896817 598896839 ... 598989676
    exposureTime     (mjd) float64 23kB 1.0 1.0 1.0 1.0 1.0 ... 1.0 1.0 1.0 1.0
    temperature      (mjd) float64 23kB -13.09 -12.96 -12.92 ... -13.0 -13.09
    tempavg          (mjd) float64 23kB 0.0 0.0 0.0 0.0 0.0 ... 0.0 0.0 0.0 0.0
    mode             (mjd) int64 23kB 1294 1294 1294 1294 ... 1294 1294 1294
    scienceprog      (mjd) int64 23kB 4092 4092 4092 4092 ... 4092 4092 4092
    ...               ...
    processingflags  (mjd) int64 23kB 0 0 0 0 0 0 0 0 0 0 ... 0 0 0 0 0 0 0 0 0
    data             (mjd, pixel) float64 3MB 0.0 0.0 ... 8.121e+11 5.881e+11
    error            (mjd, pixel) float64 3MB 2.3e+10 2.3e+10 ... 2.3e+10
    flags            (mjd, pixel) int64 3MB 0 0 0 0 0 0 0 0 ... 0 0 0 0 0 0 0 0
    orbit            int64 8B 6432
    channel          int64 8B 1
The corresponding pointing, position, tangent point, and sza info can be accessed through the ‘l1’ xarray accessor
[4]:
print(ir.l1.look_ecef)
print(ir.l1.position_ecef)
print(ir.l1.altitude)
<xarray.DataArray (mjd: 2893, pixel: 128, xyz: 3)> Size: 9MB
array([[[ 0.36142285, -0.15186206,  0.91995187],
        [ 0.36165196, -0.1520894 ,  0.91982426],
        [ 0.36188102, -0.15231672,  0.91969655],
        ...,
        [ 0.38971492, -0.18012921,  0.90314769],
        [ 0.38993837, -0.18035406,  0.90300636],
        [ 0.39016177, -0.18057887,  0.90286492]],

       [[ 0.36211812, -0.15260177,  0.91955596],
        [ 0.36234707, -0.15282908,  0.91942801],
        [ 0.36257598, -0.15305637,  0.91929996],
        ...,
        [ 0.39039019, -0.18086358,  0.90270918],
        [ 0.39061347, -0.18108838,  0.90256751],
        [ 0.39083671, -0.18131315,  0.90242574]],

       [[ 0.3631572 , -0.15370826,  0.91896171],
        [ 0.36338592, -0.15393551,  0.91883325],
        [ 0.3636146 , -0.15416274,  0.91870467],
        ...,
...
        ...,
        [ 0.27569692, -0.30767461,  0.91067422],
        [ 0.27581061, -0.30797328,  0.91053883],
        [ 0.27592426, -0.30827191,  0.91040333]],

       [[ 0.26173752, -0.2715344 ,  0.92615471],
        [ 0.26185506, -0.27183728,  0.92603262],
        [ 0.26197256, -0.27214013,  0.92591043],
        ...,
        [ 0.27618046, -0.30912964,  0.91003474],
        [ 0.27629394, -0.30942815,  0.90989883],
        [ 0.27640739, -0.30972662,  0.90976281]],

       [[        nan,         nan,         nan],
        [        nan,         nan,         nan],
        [        nan,         nan,         nan],
        ...,
        [        nan,         nan,         nan],
        [        nan,         nan,         nan],
        [        nan,         nan,         nan]]])
Coordinates:
  * mjd      (mjd) float64 23kB 5.239e+04 5.239e+04 ... 5.239e+04 5.239e+04
  * pixel    (pixel) int64 1kB 0 1 2 3 4 5 6 7 ... 121 122 123 124 125 126 127
  * xyz      (xyz) <U1 12B 'x' 'y' 'z'
<xarray.DataArray (mjd: 2893, xyz: 3)> Size: 69kB
array([[-5216570.81095428,  4643072.58023742,    11695.44940687],
       [-5215134.71934416,  4644625.66671516,    21990.11973872],
       [-5213024.95589154,  4646865.74762188,    36957.68438942],
       ...,
       [-2864158.94169273,  6369399.27920743,   -29287.7921628 ],
       [-2861369.47845388,  6370675.56016623,   -14320.19356146],
       [              nan,               nan,               nan]])
Coordinates:
  * mjd      (mjd) float64 23kB 5.239e+04 5.239e+04 ... 5.239e+04 5.239e+04
  * xyz      (xyz) <U1 12B 'x' 'y' 'z'
<xarray.DataArray (mjd: 2893, pixel: 128)> Size: 3MB
array([[ 1.14418810e+05,  1.13528085e+05,  1.12636583e+05, ...,
        -2.91651930e+03, -3.90364144e+03, -4.89152763e+03],
       [ 1.15484291e+05,  1.14594509e+05,  1.13703949e+05, ...,
        -1.73428720e+03, -2.72048439e+03, -3.70744577e+03],
       [ 1.16914394e+05,  1.16025880e+05,  1.15136588e+05, ...,
        -1.47122374e+02, -1.13207528e+03, -2.11779259e+03],
       ...,
       [ 1.47220312e+05,  1.46358629e+05,  1.45496164e+05, ...,
         3.34841372e+04,  3.25255475e+04,  3.15661894e+04],
       [ 1.48523283e+05,  1.47662805e+05,  1.46801545e+05, ...,
         3.49364582e+04,  3.39790521e+04,  3.30208774e+04],
       [            nan,             nan,             nan, ...,
                    nan,             nan,             nan]])
Coordinates:
  * mjd      (mjd) float64 23kB 5.239e+04 5.239e+04 ... 5.239e+04 5.239e+04
  * pixel    (pixel) int64 1kB 0 1 2 3 4 5 6 7 ... 121 122 123 124 125 126 127
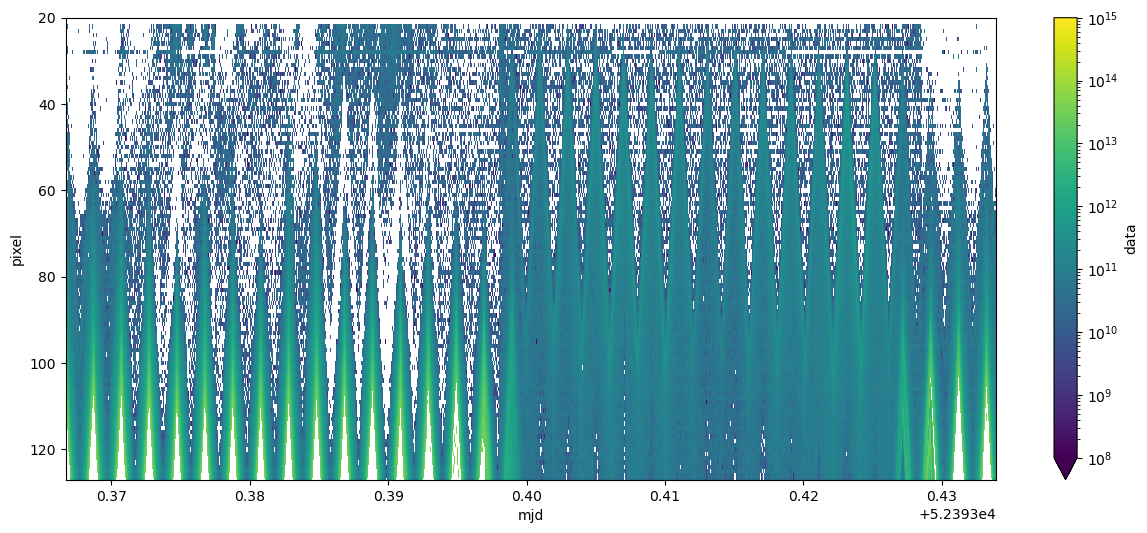
Plot the data vs pixel
[5]:
warnings.filterwarnings('ignore')

ir.data.plot(x='mjd', y='pixel', norm=LogNorm(), vmin=1e8, vmax=1e15, figsize=FIG_SIZE)
plt.ylim(127, 20)
[5]:
(127.0, 20.0)

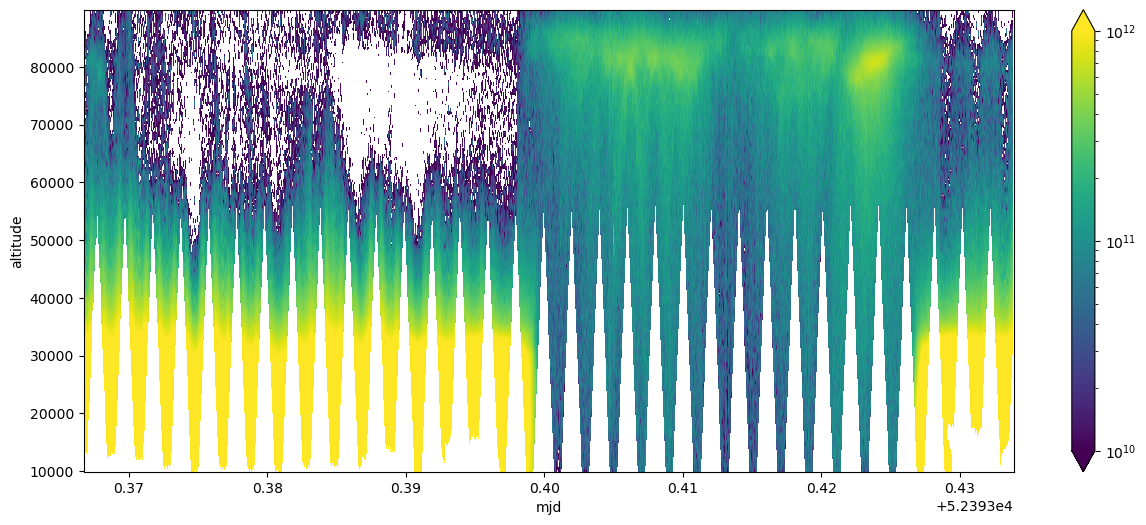
Plot the data vs altitude
[6]:
alts = np.arange(10000., 90000., 250.)
ir_altitude = []
for (data, alt) in zip(ir.data, ir.l1.altitude):
    f = interp1d(alt, data, bounds_error=False)
    ir_altitude.append(f(alts))
ir_altitude = xr.DataArray(ir_altitude, coords=[ir.mjd, alts], dims=['mjd', 'altitude'])
ir_altitude.plot(x='mjd', y='altitude', norm=LogNorm(), vmin=1e10, vmax=1e12, figsize=FIG_SIZE)
[6]:
<matplotlib.collections.QuadMesh at 0x7f81391a3460>

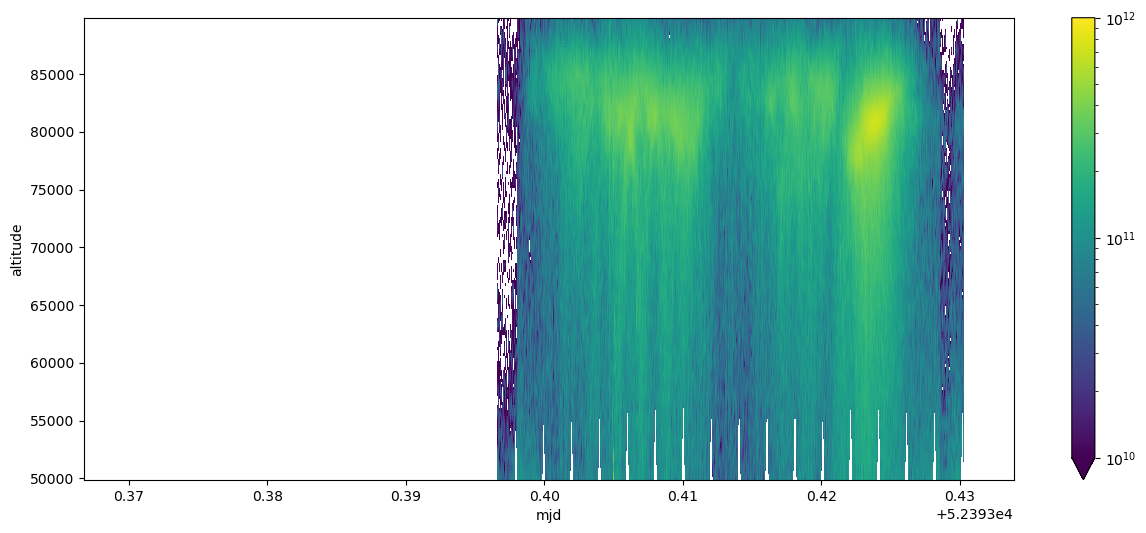
Plot just night-time data vs altitude (be patient, calculating the sza’s takes a minute)
[7]:
ir_night = ir.where(ir.l1.sza > 90.)
ir_night_altitudes = ir.l1.altitude.where(ir.l1.sza > 90.)

alts = np.arange(50000., 90000., 250.)
ir_altitude = []
for (data, alt) in zip(ir_night.data, ir_night_altitudes):
    f = interp1d(alt, data, bounds_error=False)
    ir_altitude.append(f(alts))
ir_altitude = xr.DataArray(ir_altitude, coords=[ir.mjd, alts], dims=['mjd', 'altitude'])
ir_altitude.plot(x='mjd', y='altitude', norm=LogNorm(), vmin=1e10, vmax=1e12, figsize=FIG_SIZE)
[7]:
<matplotlib.collections.QuadMesh at 0x7f80bebe3c40>
