HITRAN Molecules
Calculates the optical absorption and extinction of various atmospheric molecules using the Voigt line-shape and the HITRAN spectral line database. The object supports all of the HITRAN species specified in the HITRAN database. The current version uses the database files downloaded by the Hitran HAPI interface. Automatic download support for the HAPI interface is built into the Sasktran Python implementation. The general notation is to replace the XXX in* HITRANCHEMICAL_XXX* with the uppercase chemical name (e.g. H2O) to produce HITRANCHEMICAL_H2O. The exception to the rule is the NO+ molecule (hitran index 36) which is specified as HITRANCHEMICAL_NOPLUS.
SasktranIF Name |
Molecule |
Notes |
Molecule Number |
|---|---|---|---|
HITRANCHEMICAL_H2O |
H2O |
Water |
1 |
HITRANCHEMICAL_CO2 |
CO2 |
Carbon Dioxide |
2 |
HITRANCHEMICAL_O3 |
O3 |
Ozone |
3 |
HITRANCHEMICAL_N2O |
N2O |
Nitrogen oxide |
4 |
HITRANCHEMICAL_CO |
CO |
Carbon Monoxide |
5 |
HITRANCHEMICAL_CH4 |
CH4 |
Methane |
6 |
HITRANCHEMICAL_O2 |
O2 |
Oxygen |
7 |
HITRANCHEMICAL_NO |
NO |
Nitric Oxide |
8 |
HITRANCHEMICAL_SO2 |
SO2 |
Sulfur Dioxide |
9 |
HITRANCHEMICAL_NO2 |
NO2 |
Nitrogen Dioxide |
10 |
HITRANCHEMICAL_NH3 |
NH3 |
Ammonia |
11 |
HITRANCHEMICAL_HNO3 |
HNO3 |
Nitric Acid |
12 |
HITRANCHEMICAL_OH |
OH |
Hydroxyl |
13 |
HITRANCHEMICAL_HF |
HF |
Hydrogen Fluoride |
14 |
HITRANCHEMICAL_HCL |
HCl |
Hydrogen Chloride |
15 |
HITRANCHEMICAL_HBR |
HBr |
Hydrogen Bromide |
16 |
HITRANCHEMICAL_HI |
HI |
Hydrogen Iodide |
17 |
HITRANCHEMICAL_CLO |
ClO |
Chlorine Monoxide |
18 |
HITRANCHEMICAL_OCS |
OCS |
Carbonyl Sulfide |
19 |
HITRANCHEMICAL_H2CO |
H2CO |
Formaldehyde |
20 |
HITRANCHEMICAL_HOCL |
HOCl |
Hypochlorous Acid |
21 |
HITRANCHEMICAL_N2 |
N2 |
Nitrogen |
22 |
HITRANCHEMICAL_HCN |
HCN |
Hydrogen Cyanide |
23 |
HITRANCHEMICAL_CH3CL |
CH3Cl |
Methyl Chloride |
24 |
HITRANCHEMICAL_H2O2 |
H2O2 |
Hydrogen Peroxide |
25 |
HITRANCHEMICAL_C2H2 |
C2H2 |
Acetylene |
26 |
HITRANCHEMICAL_C2H6 |
C2H6 |
Ethane |
27 |
HITRANCHEMICAL_PH3 |
PH3 |
Phosphine |
28 |
HITRANCHEMICAL_COF2 |
COF2 |
Carbonyl Fluoride |
29 |
HITRANCHEMICAL_SF6 |
SF6 |
Sulfur Hexafluoride |
30 |
HITRANCHEMICAL_H2S |
H2S |
Hydrogen Sulfide |
31 |
HITRANCHEMICAL_HCOOH |
HCOOH |
Formic Acid |
32 |
HITRANCHEMICAL_HO2 |
HO2 |
Hydroperoxyl |
33 |
HITRANCHEMICAL_O |
O |
Oxygen Atom |
34 |
HITRANCHEMICAL_CLONO2 |
ClONO2 |
Chlorine Nitrate |
35 |
HITRANCHEMICAL_NOPLUS |
NO+ |
Nitric Oxide Cation |
36 |
HITRANCHEMICAL_HOBR |
HOBr |
Hypobromous Acid |
37 |
HITRANCHEMICAL_C2H4 |
C2H4 |
Ethylene |
38 |
HITRANCHEMICAL_CH3OH |
CH3OH |
Methanol |
39 |
HITRANCHEMICAL_CH3BR |
CH3Br |
Methyl Bromide |
40 |
HITRANCHEMICAL_CH3CN |
CH3CN |
Acetonitrile |
41 |
HITRANCHEMICAL_CF4 |
CF4 |
CFC-14 |
42 |
HITRANCHEMICAL_C4H2 |
C4H2 |
Diacetylene |
43 |
HITRANCHEMICAL_HC3N |
HC3N |
Cyanoacetylene |
44 |
HITRANCHEMICAL_H2 |
H2 |
Hydrogen |
45 |
HITRANCHEMICAL_CS |
CS |
Carbon Monosulfide |
46 |
HITRANCHEMICAL_SO3 |
SO3 |
Sulfur trioxide |
47 |
HITRANCHEMICAL_C2N2 |
C2N2 |
Cyanogen |
48 |
HITRANCHEMICAL_COCl2 |
COCl2 |
Phosgene |
49 |
Example using the Sasktran Python interface:
import numpy as np
import matplotlib.pyplot as plt
import sasktran as sk

wavenum = np.arange( 5900.0, 6200.0, 0.001)
wavelen = 1.0E7/wavenum
atmos   = sk.MSIS90()
heights =  5000
hitran  = sk.HITRANChemical('CH4', line_tolerance=1.0E-09)
hitran._iskopticalproperty.SetProperty('setwavenumberrange',  [5900.0, 6200.0] )
hitran._iskopticalproperty.SetProperty('enablecachedcrosssections', wavenum)
xs     = hitran.calculate_cross_sections(atmos, latitude=52.1315, longitude=-106.6335, altitude=heights, mjd=58290.75000000, wavelengths=wavelen)

plt.plot( wavenum, np.log10(skfullxs.absorption), 'k-' )
plt.title('CH4 log10(cross-sections) at {:f} km'.format(heights/1000.0))
plt.xlabel('Wavenumber cm-1')
plt.ylabel('Log10(Cross-sections) cm2')
plt.show()
Micro-Windows
The HITRAN CHEMICAL class works on the concept of a micro-window and adjusts its Voigt line-shape calculations so that
distant weak lines within the micro-window are ignored once they are below a threshold criterion. This generates a
significant computational saving when used properly but can generate choppy signals when set too aggressively.
The micro-window is specified using property SetWavenumberRange(). By default the micro-window
is set from the first call to CalculateCrossSections; the micro window is set from the min and max values of wavenumber. If only
one value is passed (as a scalar) it subtracts and adds 10 cm-1 to make a window 20 wavenumbers wide. This default is
reasonable for one calculation but may be inappropriate for subsequent calculations especially if they are outside this
default window. The micro-window must be initialized before any cross-section calculations or calls to SetLocation.
Tolerance
The HITRAN CEHMICAL implements a tolerance scheme so it can quickly reject weak/distant lines within a micro-window. The code uses two parameters to control this algorithm,
Maximum Line Strength in the micro-window
Tolerance of the calculation precision
By default the system disables this optimization as it is difficult to ensure sensible values across a broad range of scenarios. We do recommend that users who plan to do multiple calculations within a given micro-window region spend some timeenabling and tuning this feature as there can be significant speed increases.
By default the precision tolerance is disabled and the contribution from every selected line is used, however small. Setting a value of 1.0E-06 to 1.0E-09 will usually speed up most calculations with no significant loss of accuracy.
The algorithm, when enabled, is straightforward. The code finds the maximum line strength from the strongest line in the
micro-window, excluding lines in the margins. The approximate contribution from each line to any wavenumber within the micro-window is estimated using a simplified
(quick) far-field Voigt formulae and is compared to the maximum line strength. The line is rejected from the calculation if the nominal contribution is less than the
product of the maxlimum line strength in the micro-window and the tolerance setting. Any line within 5 half widths of a given wavenumber location
is always included in the full Voigt calculation regardless of line strength or tolerance. The tolerance can be
adjusted and enabled by calling property SetLineTolerance(). The user, if they wish, can manually set the
maximum line strength used by the algoritym by calling property SetMaxLineShapeStrength() otherwise the code will use
the maximum value in the micro-window.
The current algorithm works well for relatively narrow micro-windows dominated by a few strong lines but may need
adjustment if the window is wide and has regions well removed from the strongest feature. The line-rejection/tolerance
feature can be disabled by setting the SetLineTolerance() to 0.0 which guarantees that all lines
in the micro-window and margin contribute to the signal regardless of size.
Edge and Margin Effects
The HITRAN CHEMICAL code ignores any spectral lines that lie outside the micro-window and this may cause inaccuracy if
there are strong or significant lines just outside the micro-window, see figures below. To assist with this problem we automatically extend
the upper and lower wavenumber bounds of the micro-window by the margin value set in property SetMicroWindowMargin().
The lines in the margin region are treated exactly the same as lines in the micro-window region except they do not
participate in setting values for the tolerance algorithm described above.
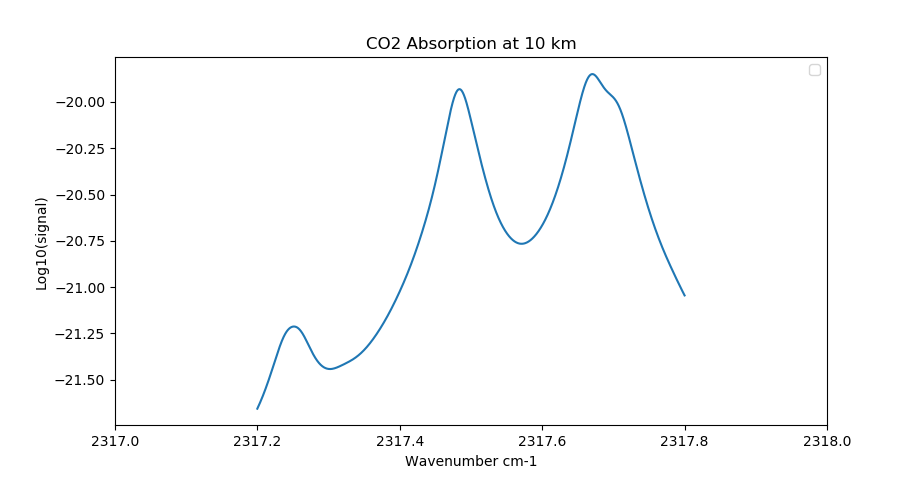
CO2 absorption using no margin. The calculation completely misses a strong line just outside the window
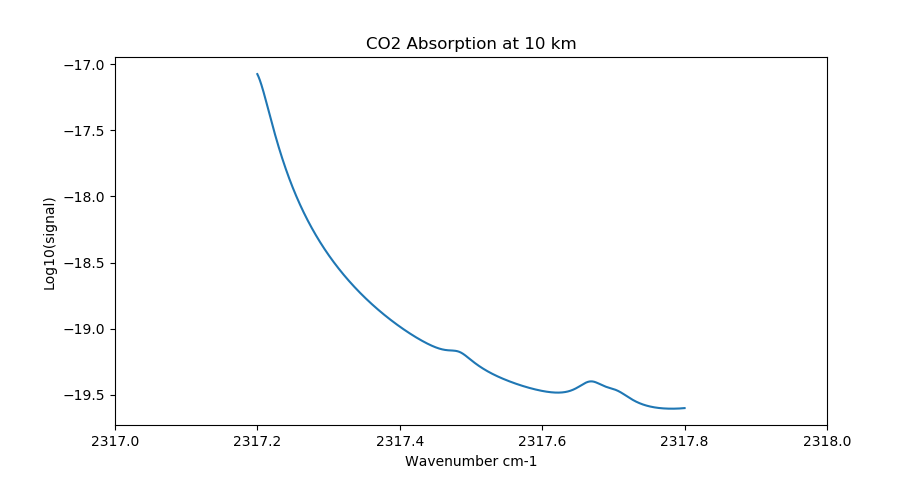
CO2 absorption using 4 nm margin. The effect of the strongline is readily evident.
The default value for the margin region is 10 wavenumbers (cm-1) at both ends of the micro-window. This is a fairly large margin and can be easily reduced to significantly smaller values for many scenarios. We strongly recommend users survey the spectral environment in the vicinity of their desired micro-window and set the margin values to appropriate values to properly account for nearby spectral lines.
Isotopes
Most molecules in the HITRAN database have several isotopic forms. By default we use all isotopes associated with the
molecule and use the abundance values implicitly set within the HITRAN database entries. The experimental property
SetIsotopeFilter() allows you to select just one isotope of the molecule although we do not
have any mechanisms to adjust for natural abundance. Please use this option with care as it is experimental.
Implementation Details
The code works with the 2016 (and onwards) HITRAN database.
It uses the 160 column files generated by the HAPI interface. The text based HAPI files are automatically scanned and cached as needed as binary files on the local disk system. This provides a significant speed advantage when reusing database entries. The same HITRAN database files are, by default, shared between different conda and python environments.
The code implements a multi-threaded C++ implementation of the Kuntz Voigt profile and includes published errata.
The results have been successfully compared to the HAPI Voigt profile calculations.
The code code uses the 2017 TIPS (Total Internal Partions) fortran code provided by the HITRAN website. The TIPS values between 70 K and 350K for each isotope are calculated and cached on a local disk at 1/64 Kelvin. This provides a significant speed advantage.
The location of the HITRAN HAPI database and the local HITRAN binary cache are controlled by registry settings. These can be modified by the user. With the Python implementation they can be modified with the sasktran_core.update_settings.modify() function. The sasktran HITRAN implementation caches the HITRAN text files as binary files for rapid loading.
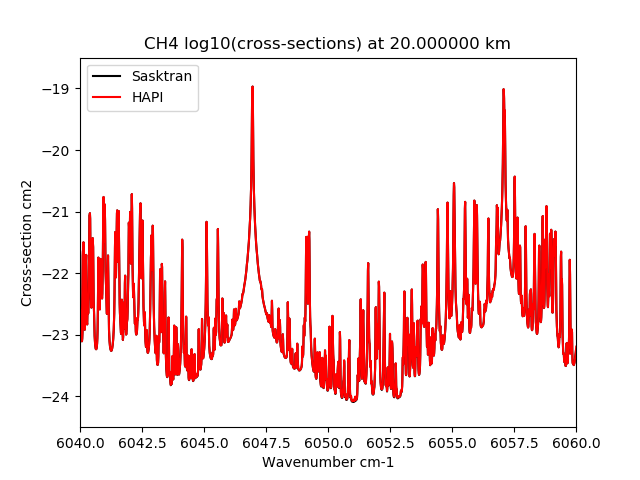
Comparison of Sasktran code and HAPI code for the methane band. Note that the Sasktran results are the same as the HAPI results. The Sasktran code was approximately 100 times faster than HAPI.
Properties
SetIsotopeFilter
- HitranChemical.SetIsotopeFilter(int isotopenumner)
Allows the HITRAN object to load in just one isotope of the requested molecule. The value set must match one of the isotope labels used for the given molecule in the HITRAN database file, molparam.txt. Note that the code does not adjust the line strength for isotopic abundance but uses the line strength value as given in the HITRAN database. This means users will have to account for the isotopic abundance themselves if they do not wish to use the value built into the HITRAN database line strength values.
- Parameters:
isotopenumber (int) – The index of the required isotope.
SetLineTolerance
- HitranChemical.SetLineTolerance(double tolerance)
Allows the user to set the tolerance factor used to reject weak lines from the current micro-window as part of a speed optimization strategy. The default value is 0.0 which disables the optimization. A larger value will speed up calculation of spectra but may result in choppy spectra at smaller intensities, especially in extinction/absorption spectra which typically follow the log of the cross-secton. A smaller value will reduce choppiness but increase computational speed. Only values greater than or equal to zero are acceptable. A value of 1.0E-09 is a good starting value if you want to enable or explore this optimization.
- Parameters:
tolerance (float) – The tolerance value. [ Default value is 0.0]
SetMaxLineStrength
- HitranChemical.SetMaxLineStrength(double maxstrength)
Allows the user to manually set the maximum line strength within a micro-window which is used as part of a speed optimization strategy. By default, the object will set this value from the strongest line in the micro-window. The value is used with the line tolerance to reject weak lines from spectral calculations. Reducing the value of the maximum line strength can reduce choppiness in the spectra. It is only used in conjunction with property
SetLineTolerance(). Only values greater than zero are acceptable while a value of zero will disable the manual setting and reinstate usage of the default.
SetWavenumberRange
- HitranChemical.SetWavenumberRange(array(2))
A 2 element array specifying the lowest and highest wavenumber of interest. This will define the micro-window used by subsequent calculations and is an important optimization. The object will discard spectral lines outside this range apart from the ones inside the marginal boundary regions neighbouring the micro-window. The value must be set during initialization before cross-sections are calculated or the location specified. The default is for the code to set the micro-window range from the minimum and maximum wavenumbers in the first call to
CalculateCrossSections().
EnableCachedCrossSections
- HitranChemical.EnableCachedCrossSections(array_of_wavenumbers(N))
An optimization to assist Sasktran engines realize the speed optimizations that are built into the Hitran code. There is a significant speed advantage to calculate the cross-sections at one location for all wavelengths of interest in one function call. This is not possible in many engines as they internally support calculating cross-sections at one wavelength only at each location. This parameter enables internal caching of the full array of cross-sections for all wavenumbers of interest at all the different locations in the atmosphere used by the engine. All subsequent calls to
SetLocation()will either result in either generating a new cache entry if it is a new location or fetching a previously calculated cache entry if is not. All calls toCalculateCrossSections()will only use cross-sections stored in the cache at the current location.The input array specifies all of the wavenumbers (in cm-1) that will be stored in the caches. Users should ensure that all the wavenumbers they plan to use in subsequent calls to
CalculateCrossSections()are in the array. The wavenumbers in the array can be in any order and do not have to be in ascending order. Needless to say, users should be careful not to request too many wavenumbers at too many locations as the resulting storage requirements may be prohibitive.
SetMicroWindowMargin
- HitranChemical.SetMicroWindowMargin(double margin)
Sets the margin of the micro-window in wavenumbers. This margin extends the upper and lower bounds of the micro-window once it is loaded into memory. The margin value is used to ensure that cross-section calculations near the edge of the micro-window are accurate and have contributions from lines outside the micro-window. The default value is 10 wavenumbers. It is the users responsibility to choose a value for the margin that provides the necessary accuracy for their aplication. The margin value must be set before any calls to
SetLocation()orCalculateCrossSections().
References
I.E. Gordon, L.S. Rothman, C. Hill, R.V. Kochanov, Y. Tan, P.F. Bernath, M. Birk, V. Boudon, A. Campargue, K.V. Chance, B.J. Drouin, J.-M. Flaud, R.R. Gamache, J.T. Hodges, D. Jacquemart, V.I. Perevalov, A. Perrin, K.P. Shine, M.-A.H. Smith, J. Tennyson, G.C. Toon, H. Tran, V.G. Tyuterev, A. Barbe, A.G. Császár, V.M. Devi, T. Furtenbacher, J.J. Harrison, J.-M. Hartmann, A. Jolly, T.J. Johnson, T. Karman, I. Kleiner, A.A. Kyuberis, J. Loos, O.M. Lyulin, S.T. Massie, S.N. Mikhailenko, N. Moazzen-Ahmadi, H.S.P. Müller, O.V. Naumenko, A.V. Nikitin, O.L. Polyansky, M. Rey, M. Rotger, S.W. Sharpe, K. Sung, E. Starikova, S.A. Tashkun, J. Vander Auwera, G. Wagner, J. Wilzewski, P. Wcis?o, S. Yu, E.J. Zak. The HITRAN2016 molecular spectroscopic database, Journal* of Quantitative Spectroscopy and Radiative Transfer*, 203, 3-69, (2017), doi.org/10.1016/j.jqsrt.2017.06.038.
M. Kuntz, “A new implementation of the Humlicek algorithm for the calculation of the Voigt profile function”, Journal of Quantitative Spectroscopy and Radiative Transfer, 57, 6, 819-824, (1997), doi.org/10.1016/S0022-4073(96)00162-8
Wim Ruyten, Comment on “A new implementation of the Humlicek algorithm for the calculation of the Voigt profile function” by M. Kuntz [JQSRT 57(6) (1997) 819–824], Journal of Quantitative Spectroscopy and Radiative Transfer, 86, 2, 231-233, (2004), doi.org/10.1016/j.jqsrt.2003.12.027.
R.V. Kochanov, I.E. Gordon, L.S. Rothman, P. Wcislo, C. Hill, J.S. Wilzewski, HITRAN Application Programming Interface (HAPI): A comprehensive approach to working with spectroscopic data, J. Quant. Spectrosc. Radiat. Transfer, 177, 15-30 (2016), doi.org/10.1016/j.jqsrt.2016.03.005