Extinction
Time Series
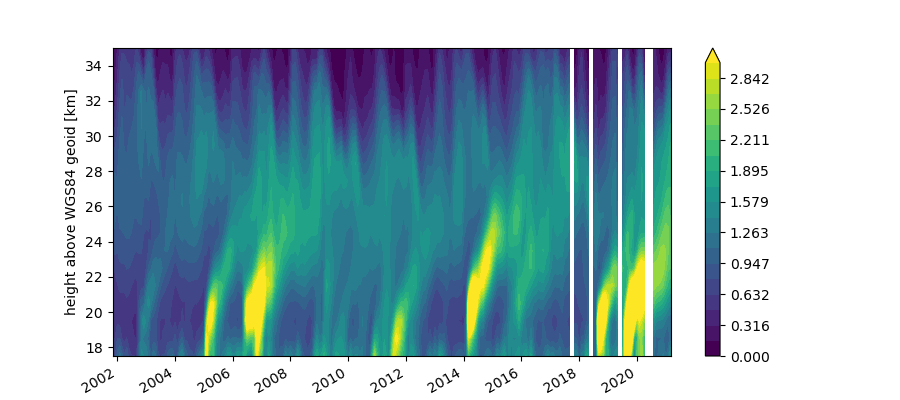
Plot the monthly mean 750 nm extinction ratio in the tropics for altitudes above the tropopause.
import os
import xarray as xr
import matplotlib.pyplot as plt

# load all of the version 7 data and set time as the dimension
v7_folder = r'path\to\v7_data'
data = xr.open_mfdataset([os.path.join(v7_folder, f) for f in os.listdir(v7_folder)])
data = data.swap_dims({'profile_id': 'time'})

rayleigh_xs = 1.278155e-22  # rayleigh cross section at 750 nm
air_density = data.pressure / ((1.380648e-23 * data.temperature) * 1e6)
ext_ratio = data.extinction / (air_density * rayleigh_xs)
ext_ratio.where((data.latitude < 10) & (data.latitude > -10))\
         .where(data.altitude > data.tropopause_altitude)\
         .resample(time='MS').mean(dim='time') \
         .plot.contourf(x='time', vmin=0, vmax=3, levels=20, ylim=[17.5, 35], figsize=[9, 4])
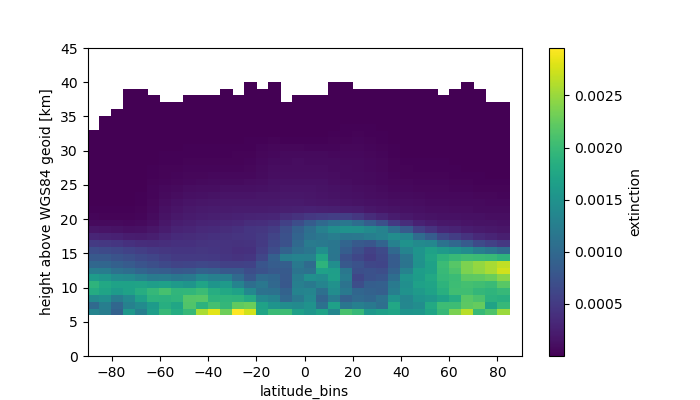
Zonal Mean
Plot the zonal mean of the 750 nm aerosol extinction in October 2011.
import os
import xarray as xr
import numpy as np

# load all of the version 7 data and set time as the dimension
v7_folder = r'path\to\v7_data'
data = xr.open_mfdataset([os.path.join(v7_folder, f) for f in os.listdir(v7_folder)])
data = data.swap_dims({'profile_id': 'time'})

lat_res = 5
lat_bins = np.arange(-90, 91, lat_res)
groups = data.extinction.sel(time='2011-10') \
             .groupby_bins(data.latitude.sel(time='2011-10'),
                           bins=lat_bins, labels=lat_bins[1:] - lat_res / 2)

groups.mean(dim='time').plot(x='latitude_bins', figsize=[7, 4])