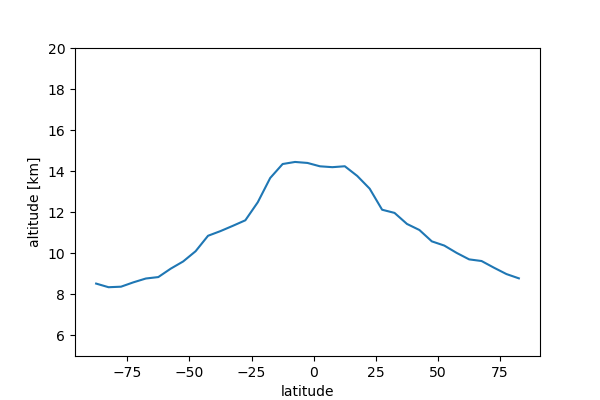
Cloud Top Altitude
The cloud top altitude is provided for scans where clouds are detected, and is otherwise set to NaN. This example plots the average cloud top altitude in 2010 as a function of latitude for scans where clouds are detected.
import os
import numpy as np
import xarray as xr
import matplotlib.pyplot as plt

# load all of the version 7 data and set time as the dimension
v7_folder = r'path\to\v7_data'
data = xr.open_mfdataset(os.path.join(v7_folder, '*.nc'))
data = data.swap_dims({'profile_id': 'time'})
data = data.sel(time='2010').compute()

# group the data into 5 degree bins
lat_bins = np.arange(-90, 91, 5)
groups = data.cloud_top_altitude \
             .groupby_bins(data.latitude,
                           bins=lat_bins, labels=lat_bins[1:] - 2.5)

# plot the mean cloud top altitude in each bin
(groups.mean(dim='time')).plot(x='latitude_bins', figsize=[6, 4])
plt.ylim(5, 20)
plt.xlabel('latitude')
plt.ylabel('altitude [km]')