Zonal Mean
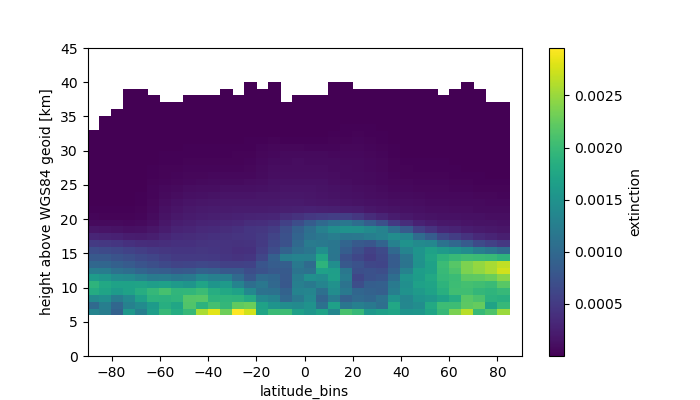
Plot the zonal mean of the 750 nm aerosol extinction in October 2011.
import os
import xarray as xr
import numpy as np

# load all of the version 7 data and set time as the dimension
v7_folder = r'path\to\v7_data'
data = xr.open_mfdataset(os.path.join(v7_folder, '*.nc'))
data = data.swap_dims({'profile_id': 'time'})
data = data.sel(time='2011-10').compute()

lat_res = 5
lat_bins = np.arange(-90, 91, lat_res)
groups = data.extinction \
             .groupby_bins(data.latitude,
                           bins=lat_bins, labels=lat_bins[1:] - lat_res / 2)

groups.mean(dim='time').plot(x='latitude_bins', figsize=[7, 4])