Latitude Binning
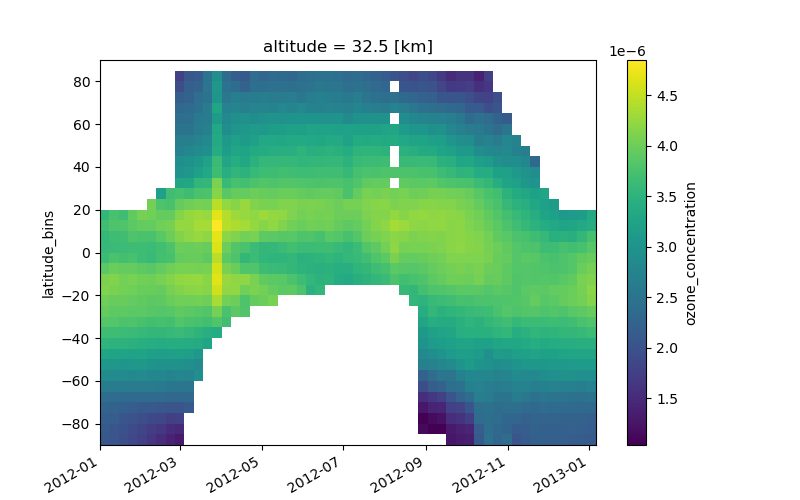
This example shows how to plot ozone at 32.5 km for weekly means grouped into 5 degree latitude bins.
import os
import xarray as xr
import pandas as pd
import numpy as np
import matplotlib.pyplot as plt

# define a function to do the latitude binning with xarray's map function
def latitude_bin(ds, lat_res, lat_min, lat_max):
    lat_bins = np.arange(lat_min, lat_max, lat_res)
    data_groups = ds.groupby_bins(ds.latitude, lat_bins, labels=lat_bins[1::] - lat_res / 2)
    data_mean = data_groups.mean(dim='time')
    return data_mean

# load the 2012 data and set time as the dimension
v7_folder = r'path\to\v7_data'
data = xr.open_mfdataset(os.path.join(v7_folder, '*.nc'))
data = data.swap_dims({'profile_id': 'time'})
data = data.sel(time='2012').compute()

# resample for weekly means
data_resample = data.resample(time='7D')
data_bin = data_resample.map(latitude_bin, args=(5, -90, 91))
# fixes the alignment of ticks to the centre of each weekly bin
data_bin['time'] = data_bin.get_index('time') + pd.tseries.frequencies.to_offset('84h')

data_bin.ozone_concentration.sel(altitude=32.5).plot(x='time', figsize=[8, 5])