# high resolution solar irradiance
wlh = np.arange(400., 470., 0.01)
irrh = sk.SolarSpectrum().irradiance(wlh)
# convolve the irradiance
fwhm = 0.3
sigma = fwhm / (2 * np.sqrt(2 * np.log(2)))
x = np.arange(-np.round(5 * sigma, 2), np.round(5 * sigma, 2), 0.01)
gaussian = np.exp(-x**2 / (2 * sigma**2)) / (sigma * np.sqrt(2 * np.pi))
irrh = np.convolve(irrh, gaussian, mode='same')
# calculate the source spectrum and the differential Ring spectrum
wl = np.arange(405., 465., 0.1)
rrs = skdoas.RingSpectrum(wlh, irrh)
# shortcut - only compute cross sections and convolve once
source = rrs.source_spectrum(wl)
ring = rrs.differential_ring_spectrum(wl, last_source=True)
# full calculation - compute cross sections and convolve at every wavelength
rrs.full = True
source_full = rrs.source_spectrum(wl)
ring_full = rrs.differential_ring_spectrum(wl, last_source=True)
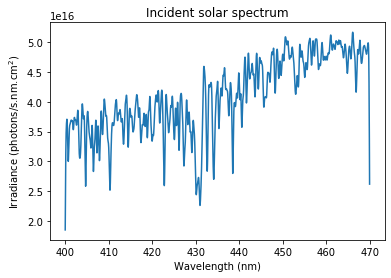
plt.figure()
plt.title('Incident solar spectrum')
plt.xlabel('Wavelength (nm)')
plt.ylabel('Irradiance (photons/s.nm.cm$^2$)')
plt.plot(wlh, irrh)
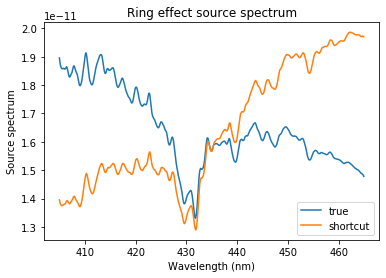
plt.figure()
plt.title('Ring effect source spectrum')
plt.xlabel('Wavelength (nm)')
plt.ylabel('Source spectrum')
plt.plot(wl, source_full, label='true')
plt.plot(wl, source, label='shortcut')
plt.legend()
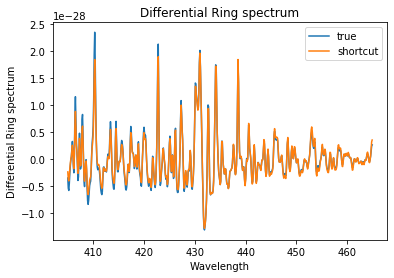
plt.figure()
plt.title('Differential Ring spectrum')
plt.xlabel('Wavelength')
plt.ylabel('Differential Ring spectrum')
plt.plot(wl, ring_full, label='true')
plt.plot(wl, ring, label='shortcut')
plt.legend()
plt.show()